1. Configure a dev server
If no dev server script is configured, the preview panel shows a setup prompt. Click Edit Dev Server Script to open the script dialog.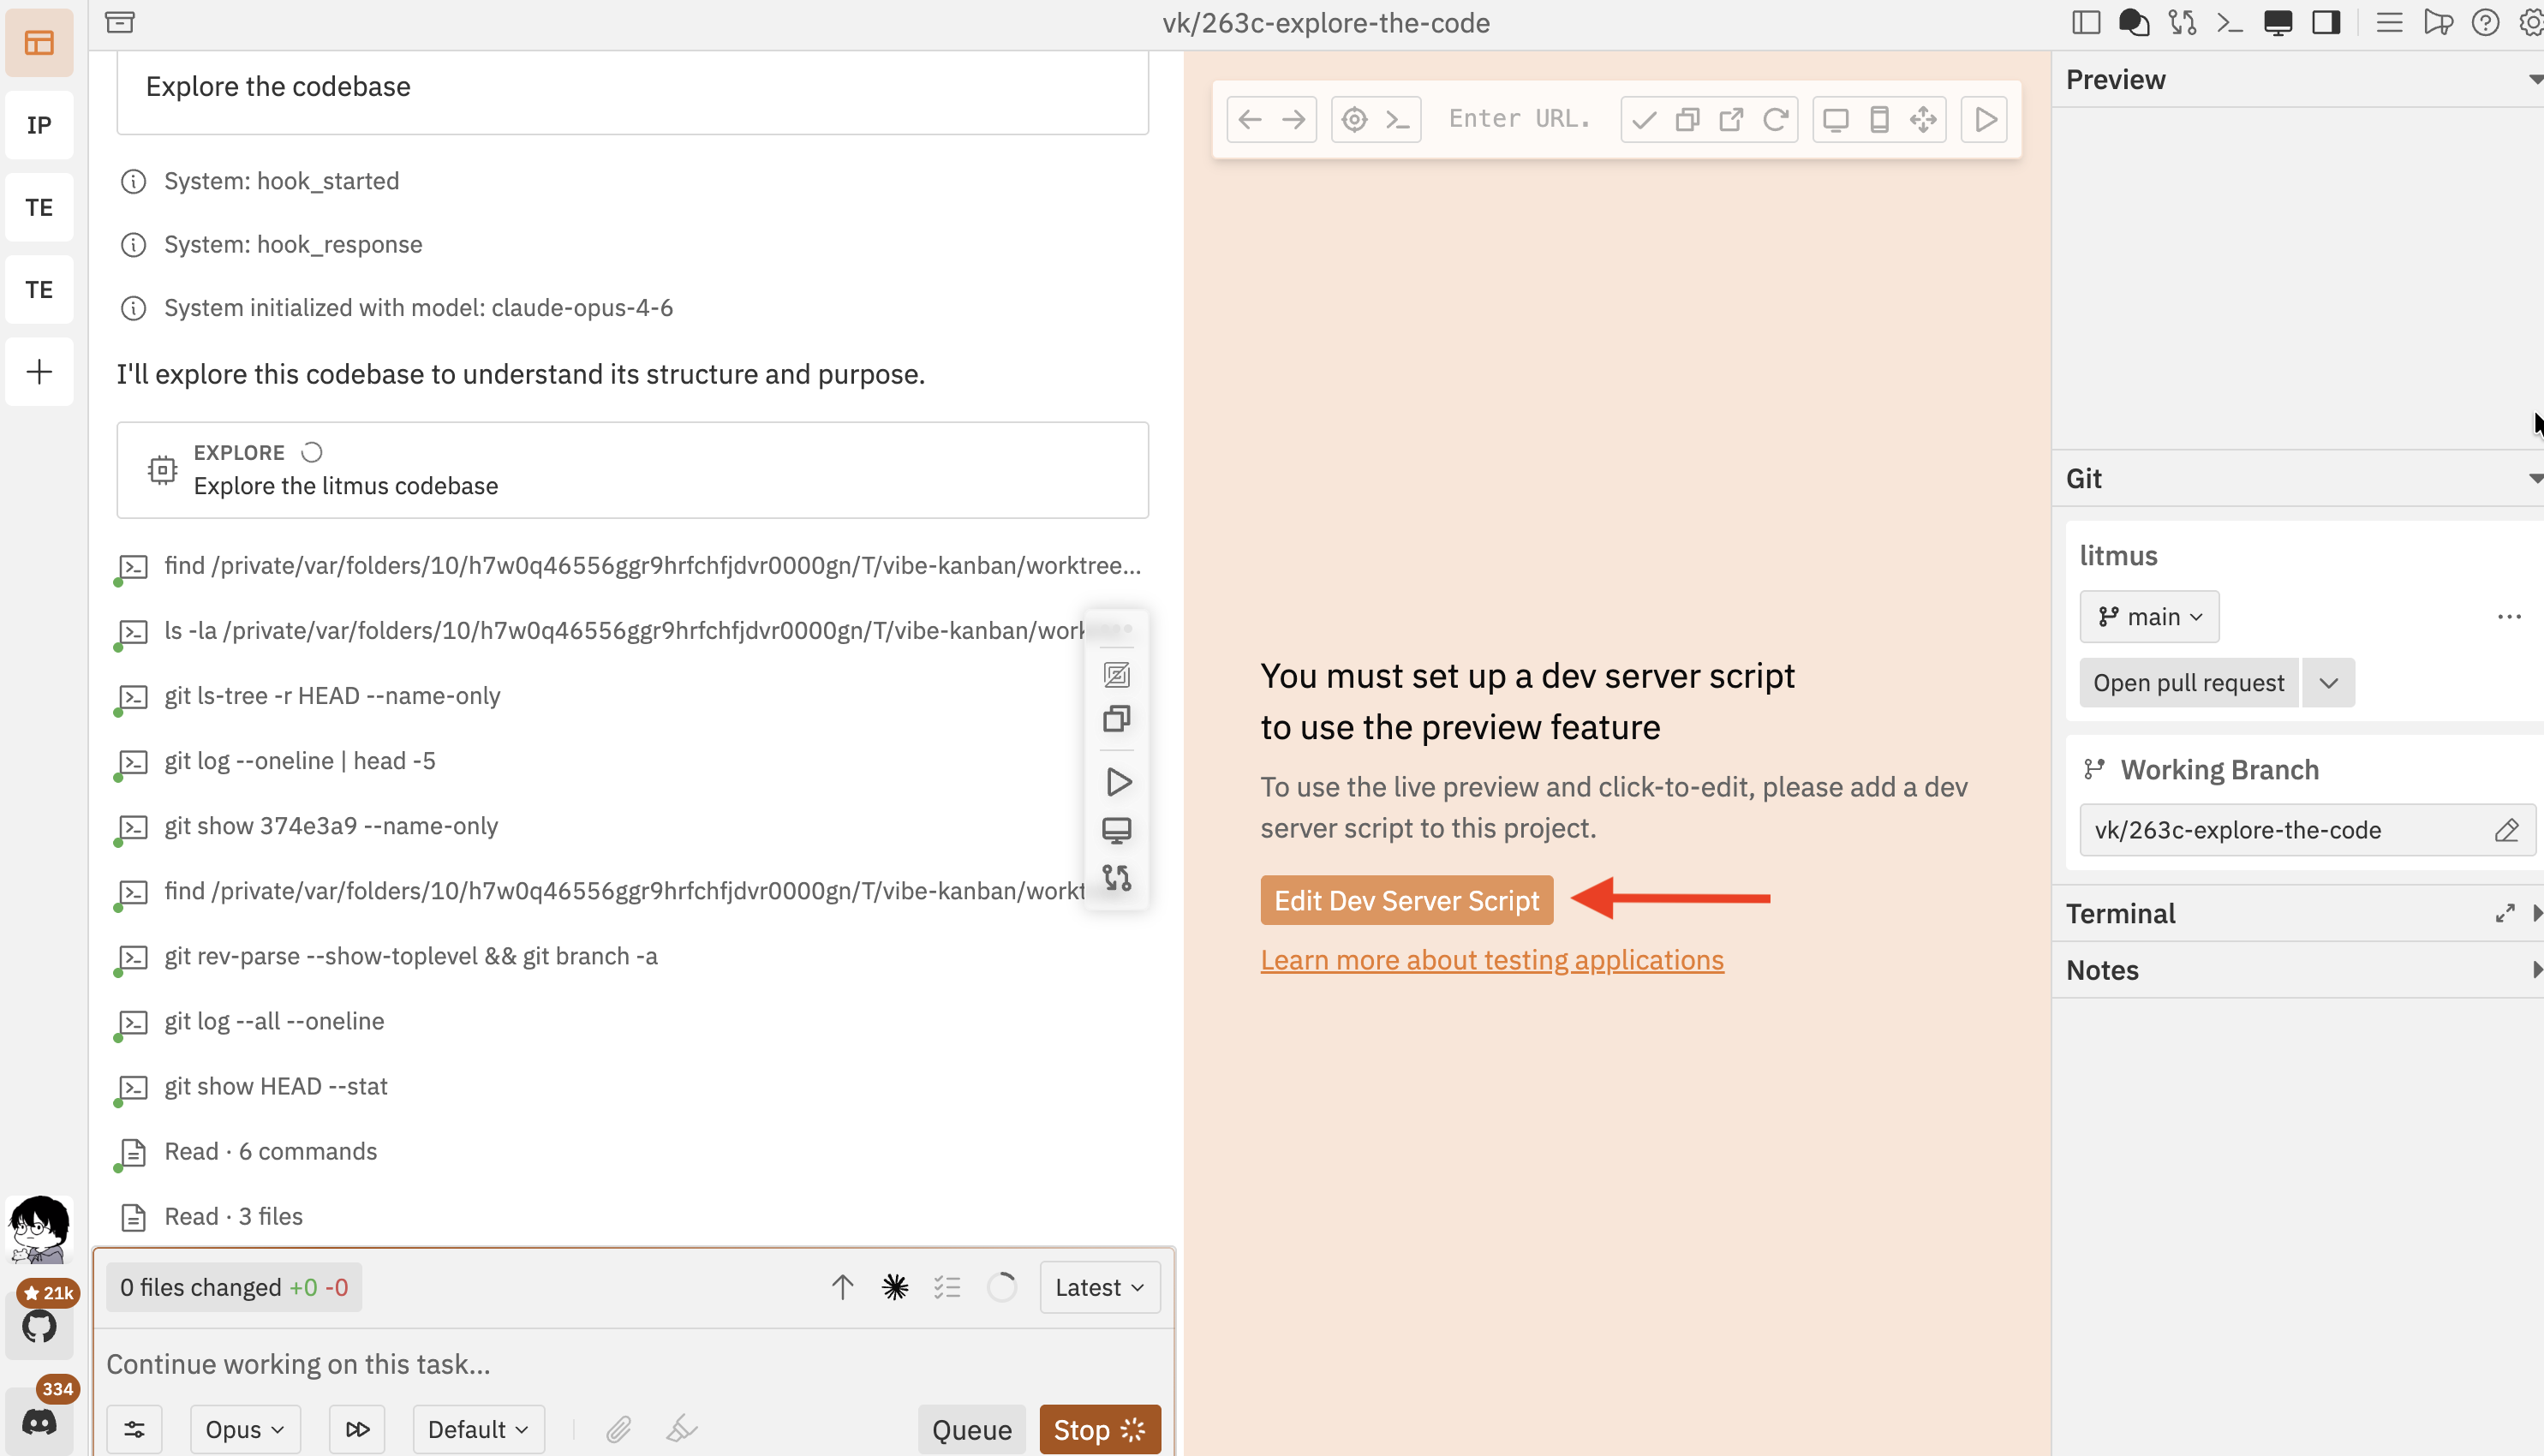
npm run dev, pnpm dev, yarn dev) and click Save and Test to verify it works.
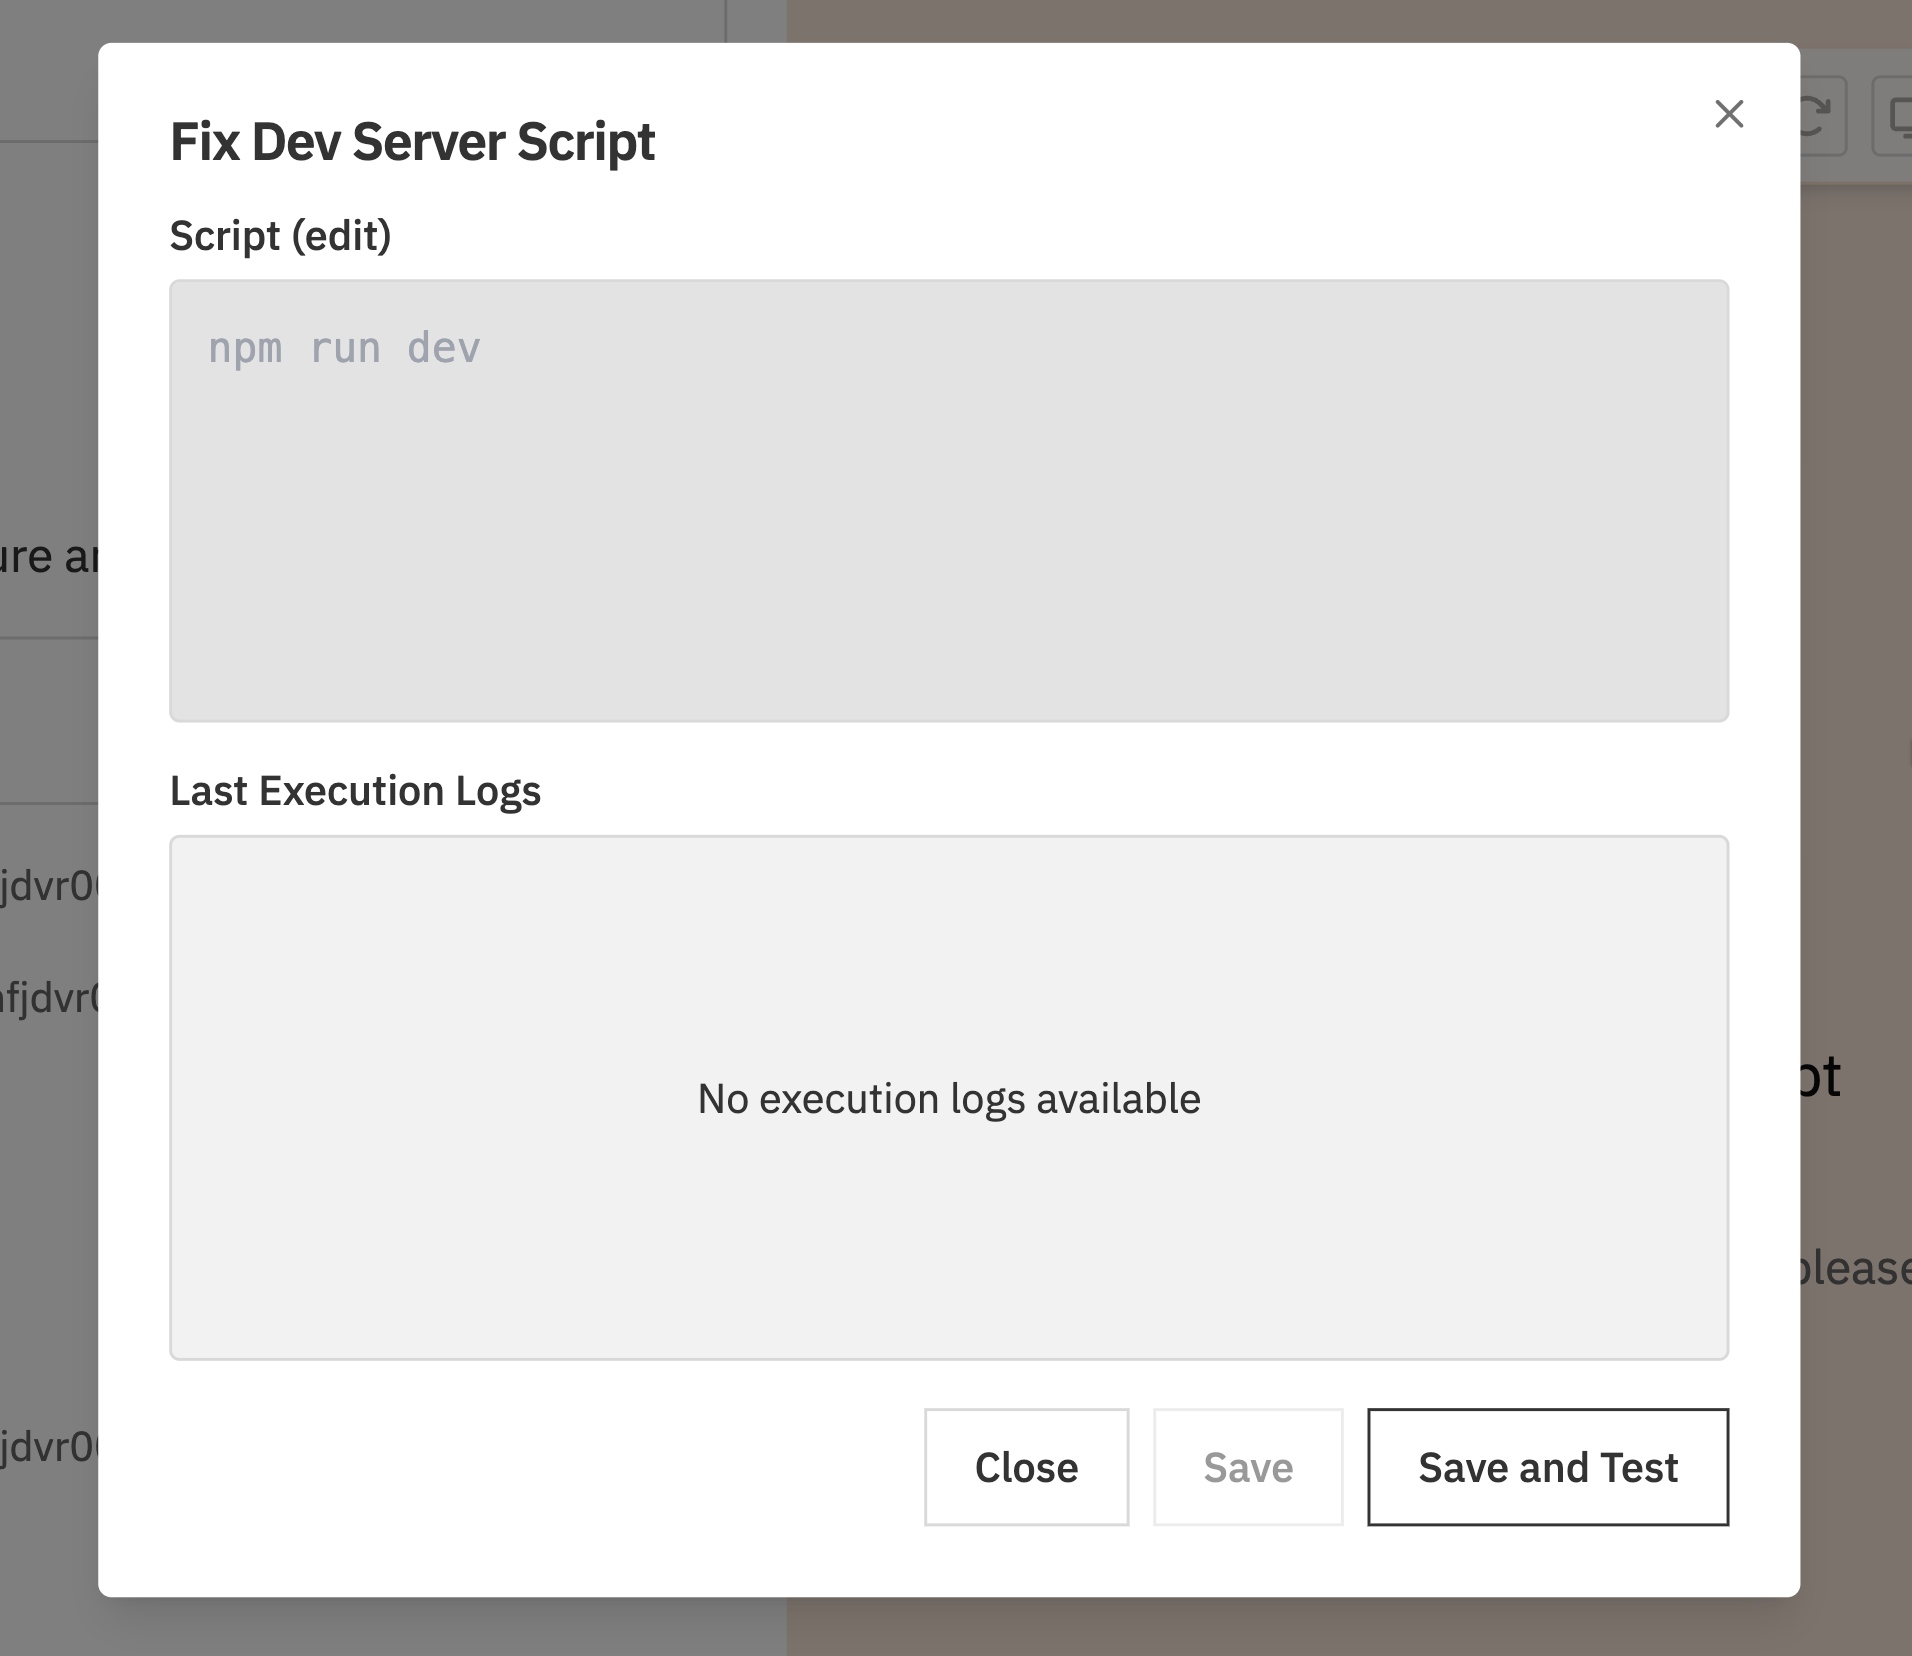
You can also configure dev server scripts from Settings → Repos → select your repository → Dev Server Script. See Projects & Repositories for details.
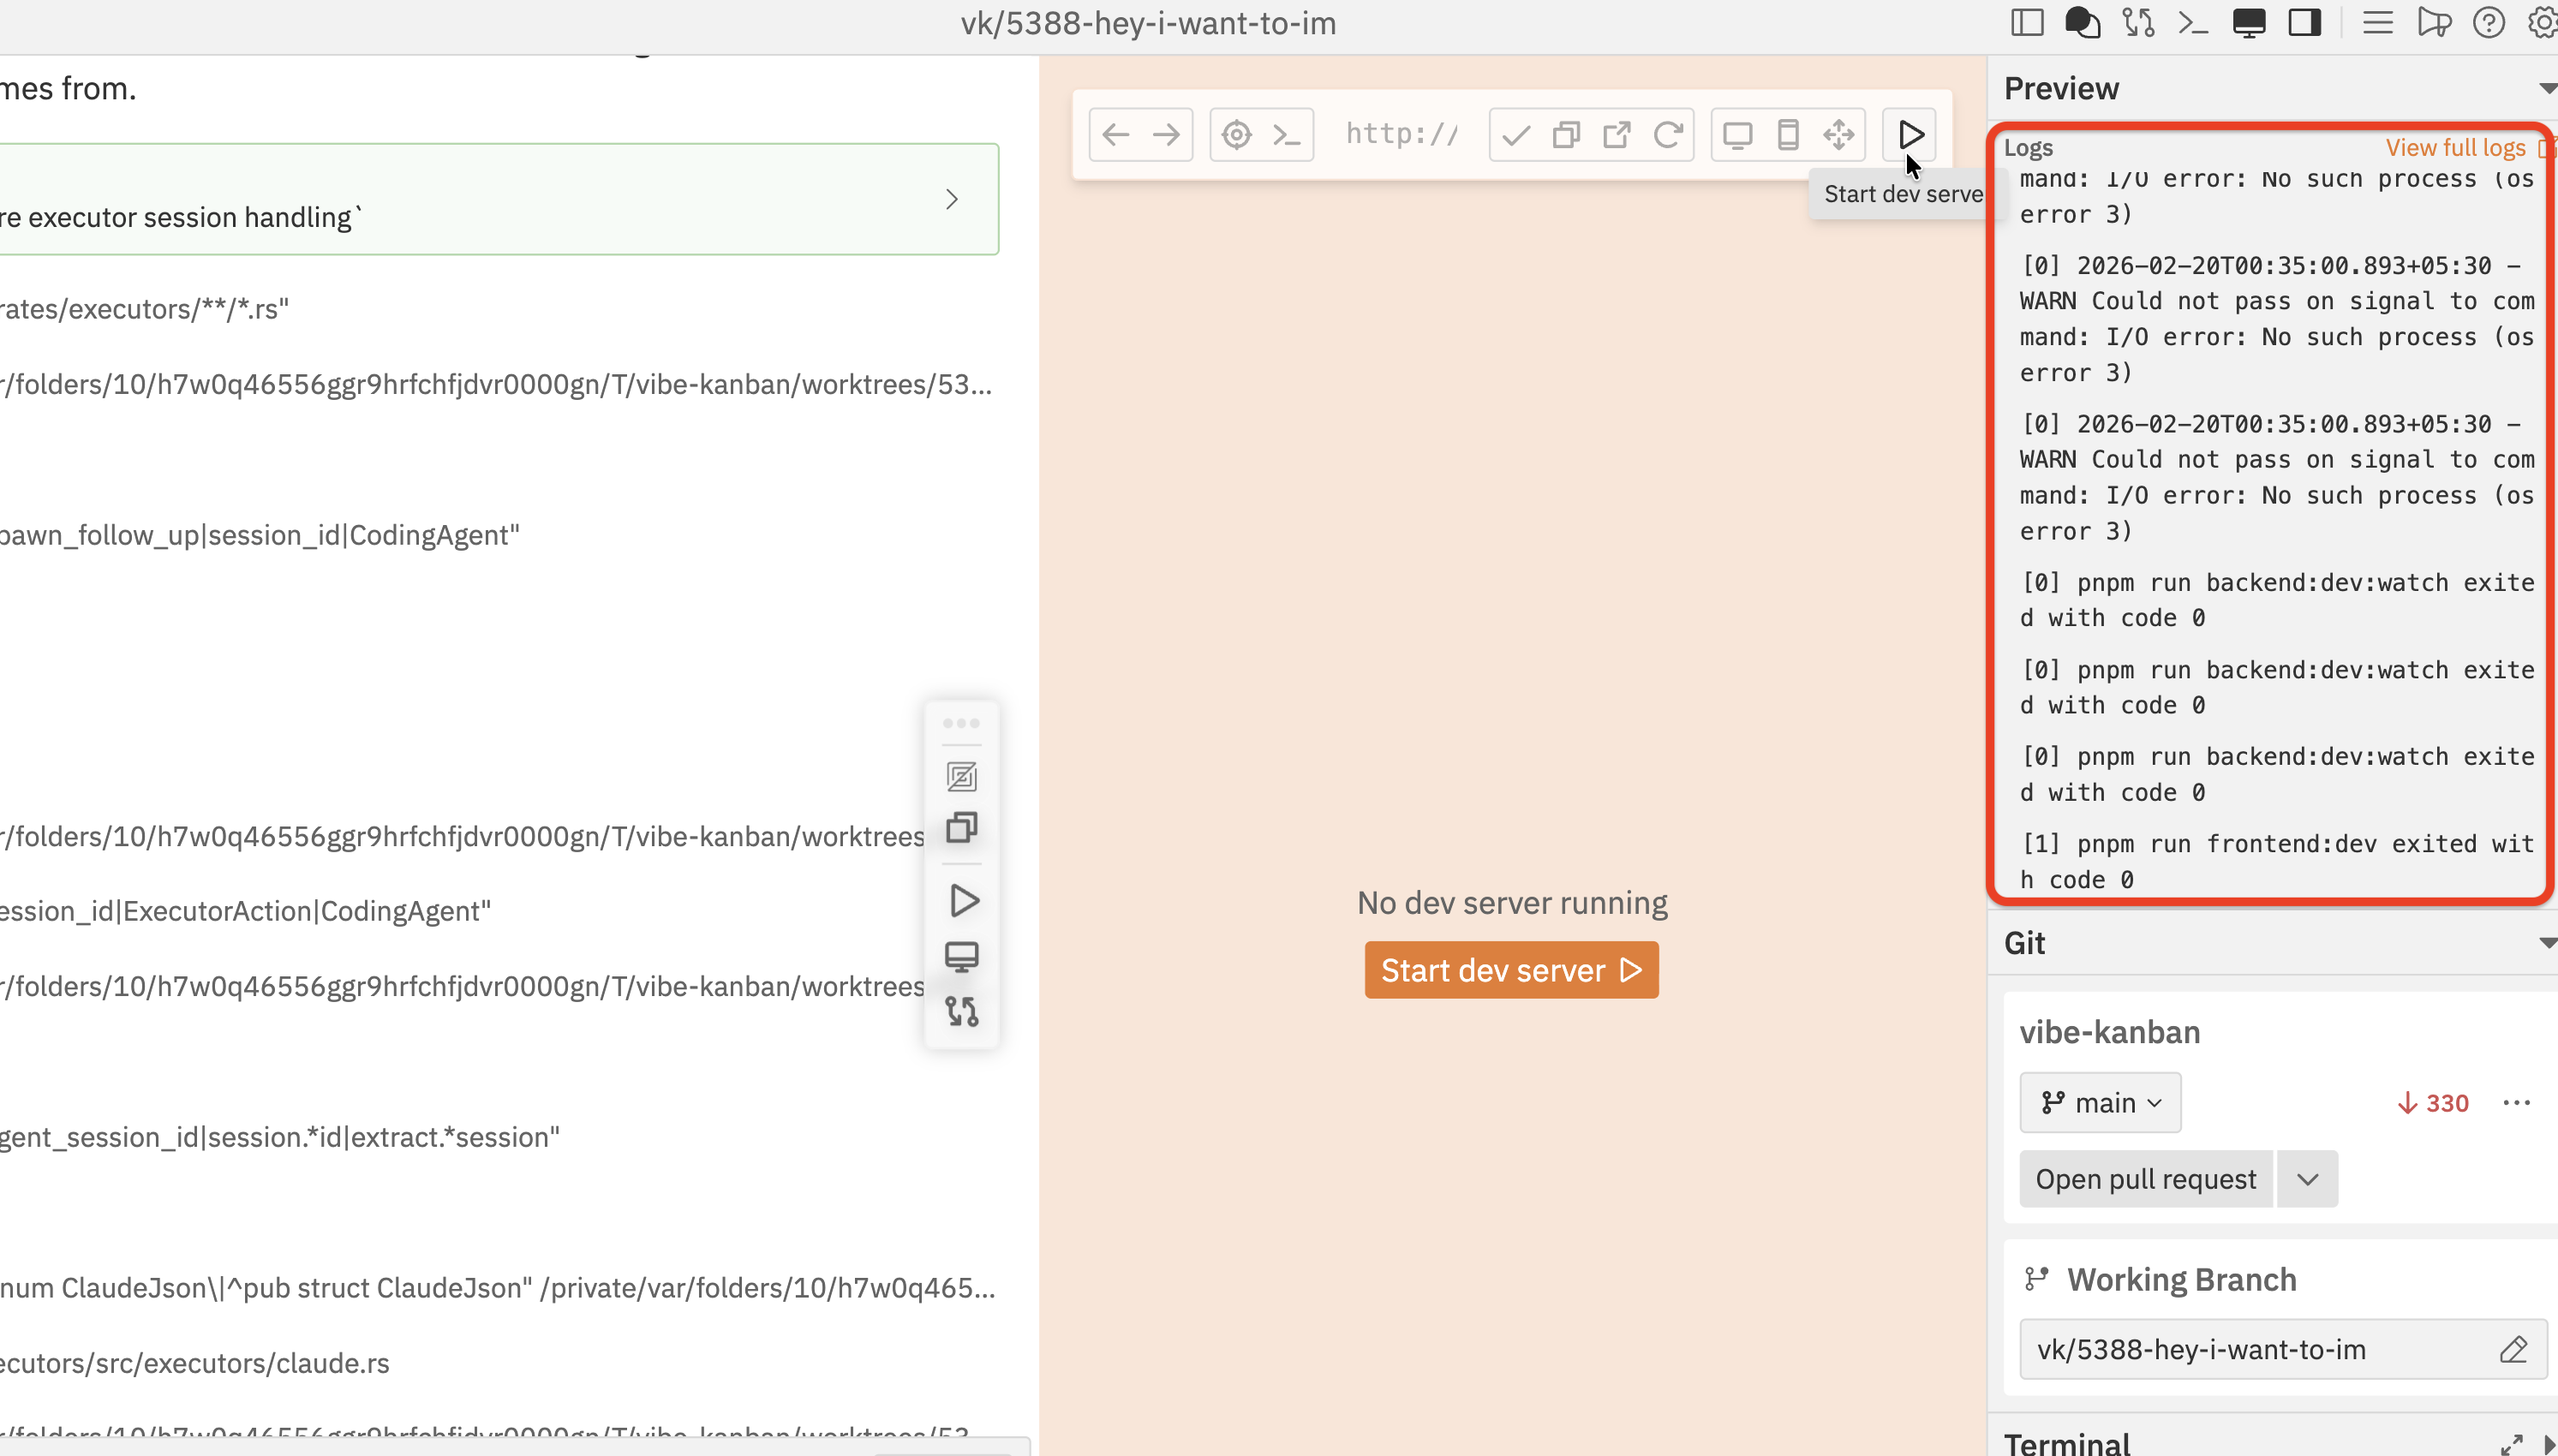
2. Start the dev server
Once you’ve saved a script, click Start dev server in the preview panel to launch it.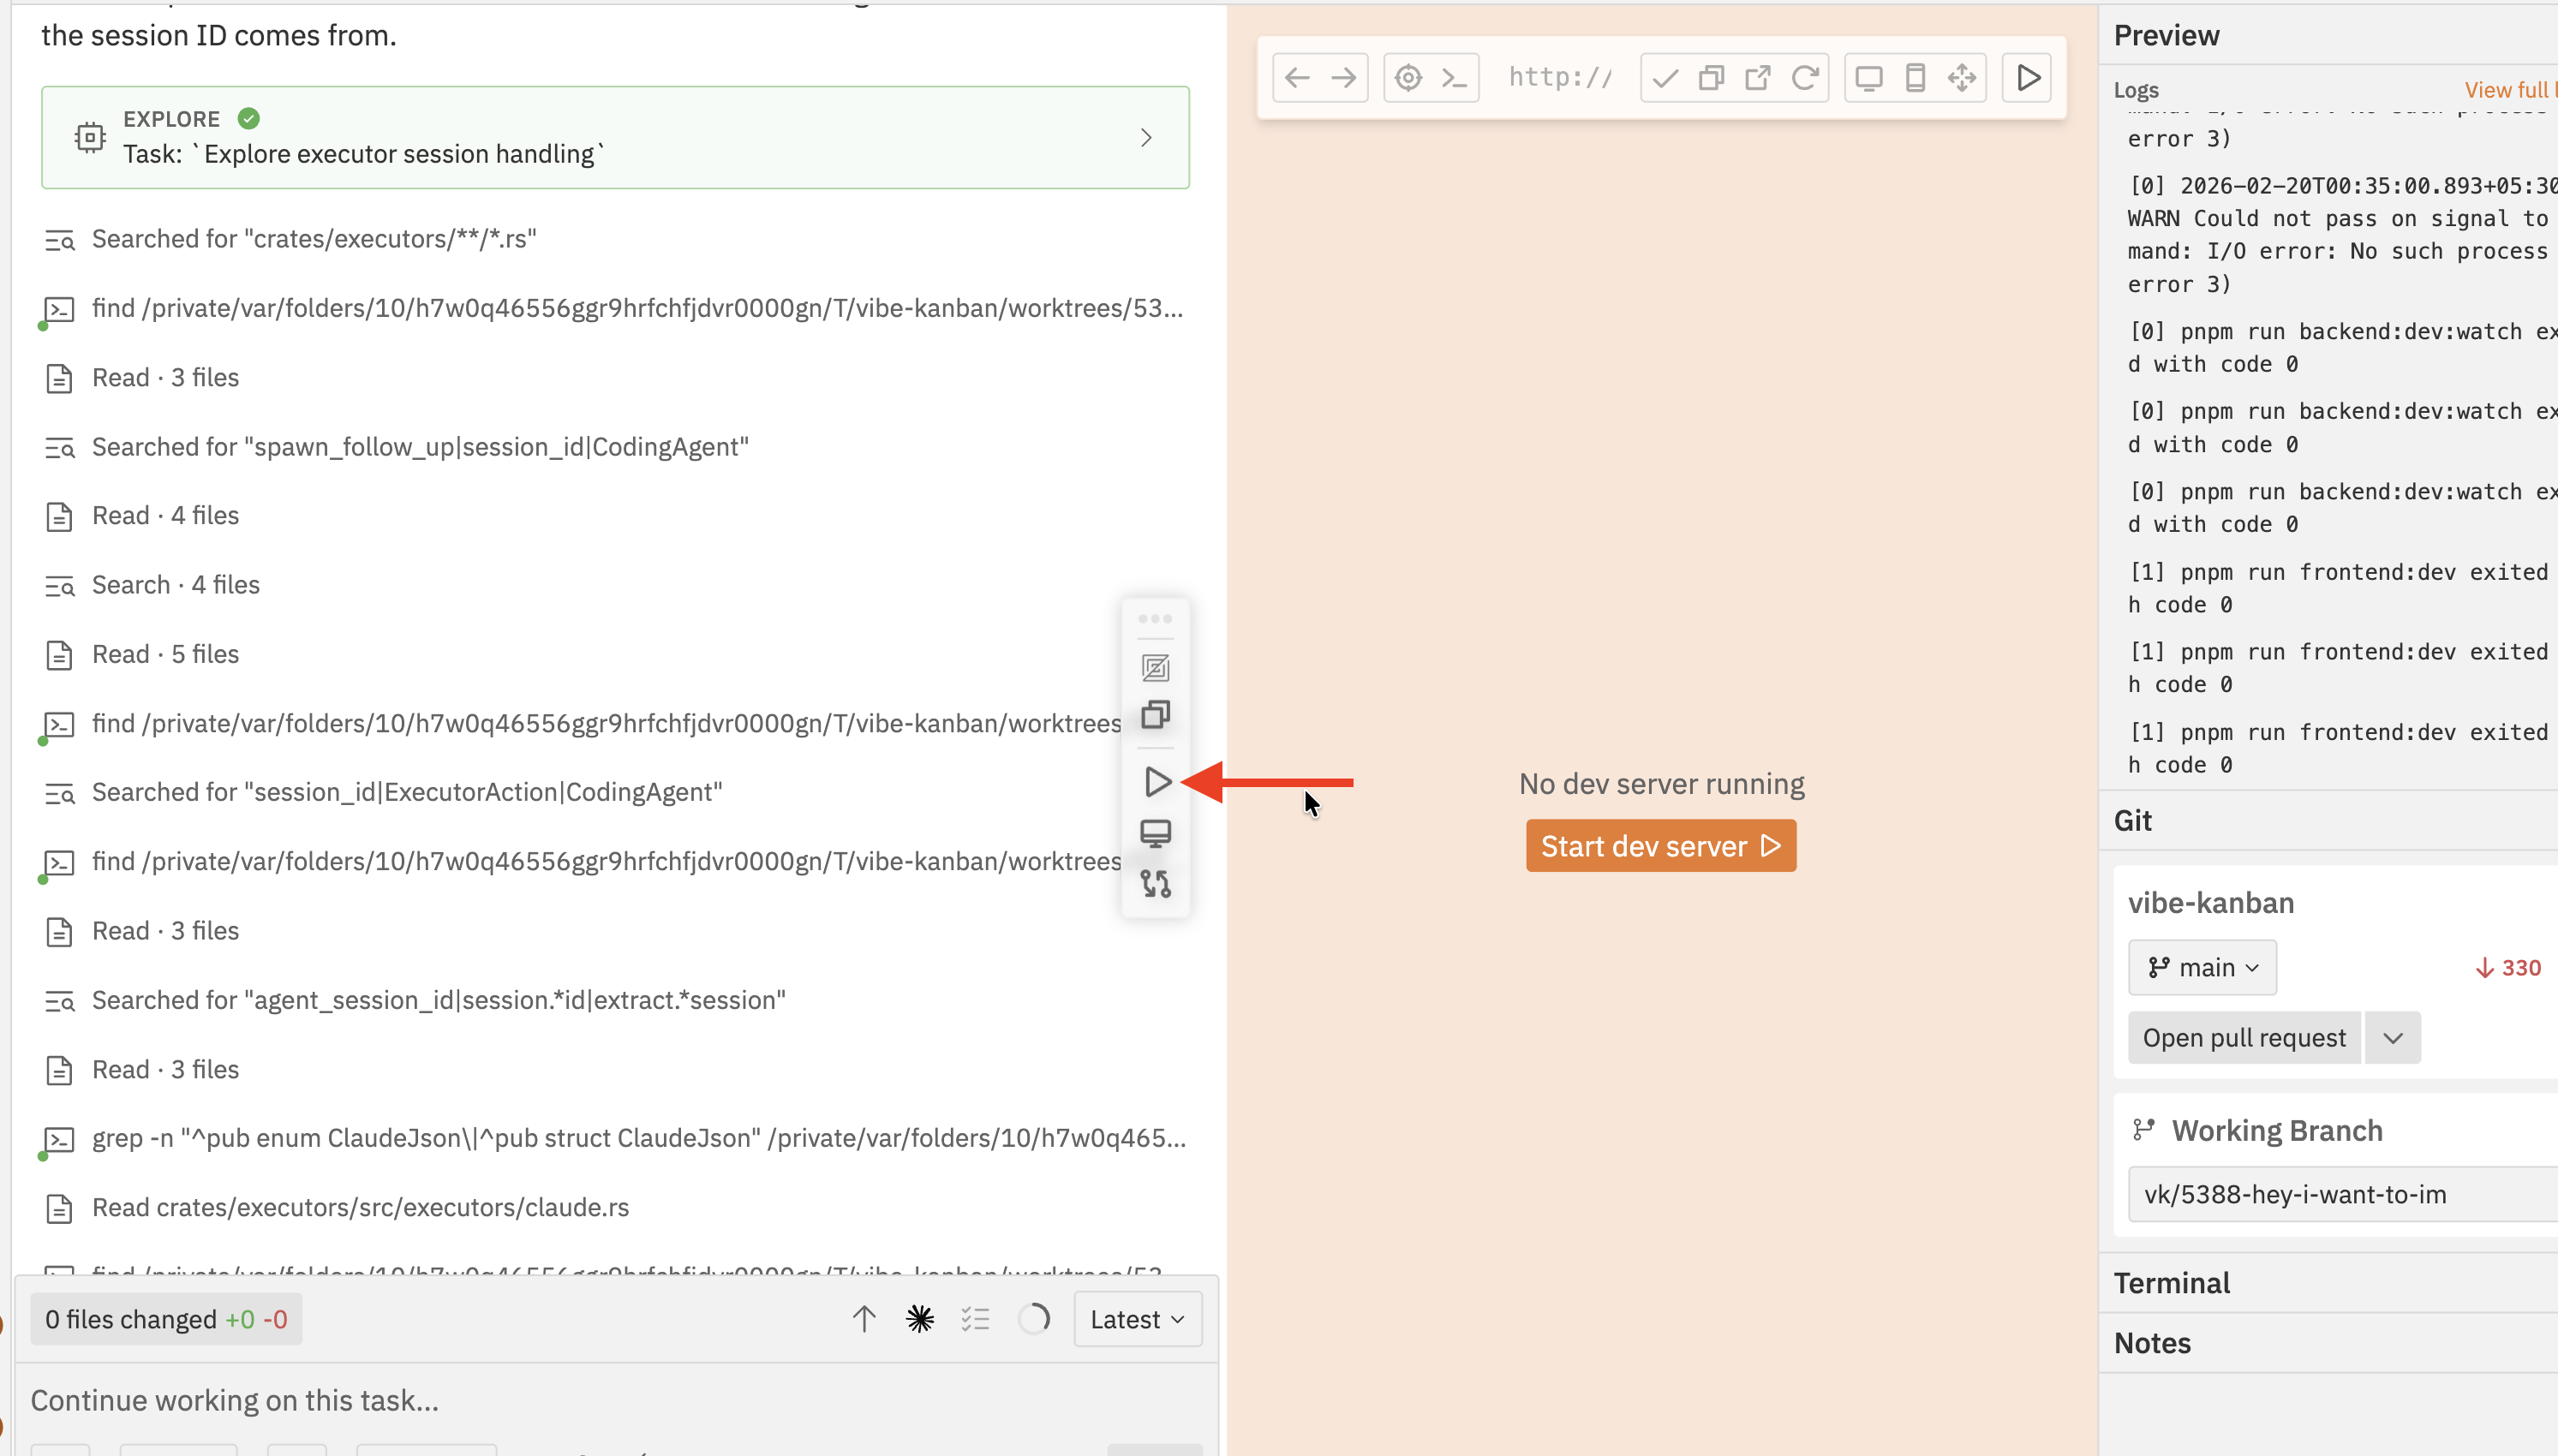
http://localhost:3000) — Vibe Kanban detects this automatically and loads it in the preview.
3. The preview browser
Once the dev server starts, your application loads in the built-in browser. Here’s an overview of the preview toolbar and what each control does.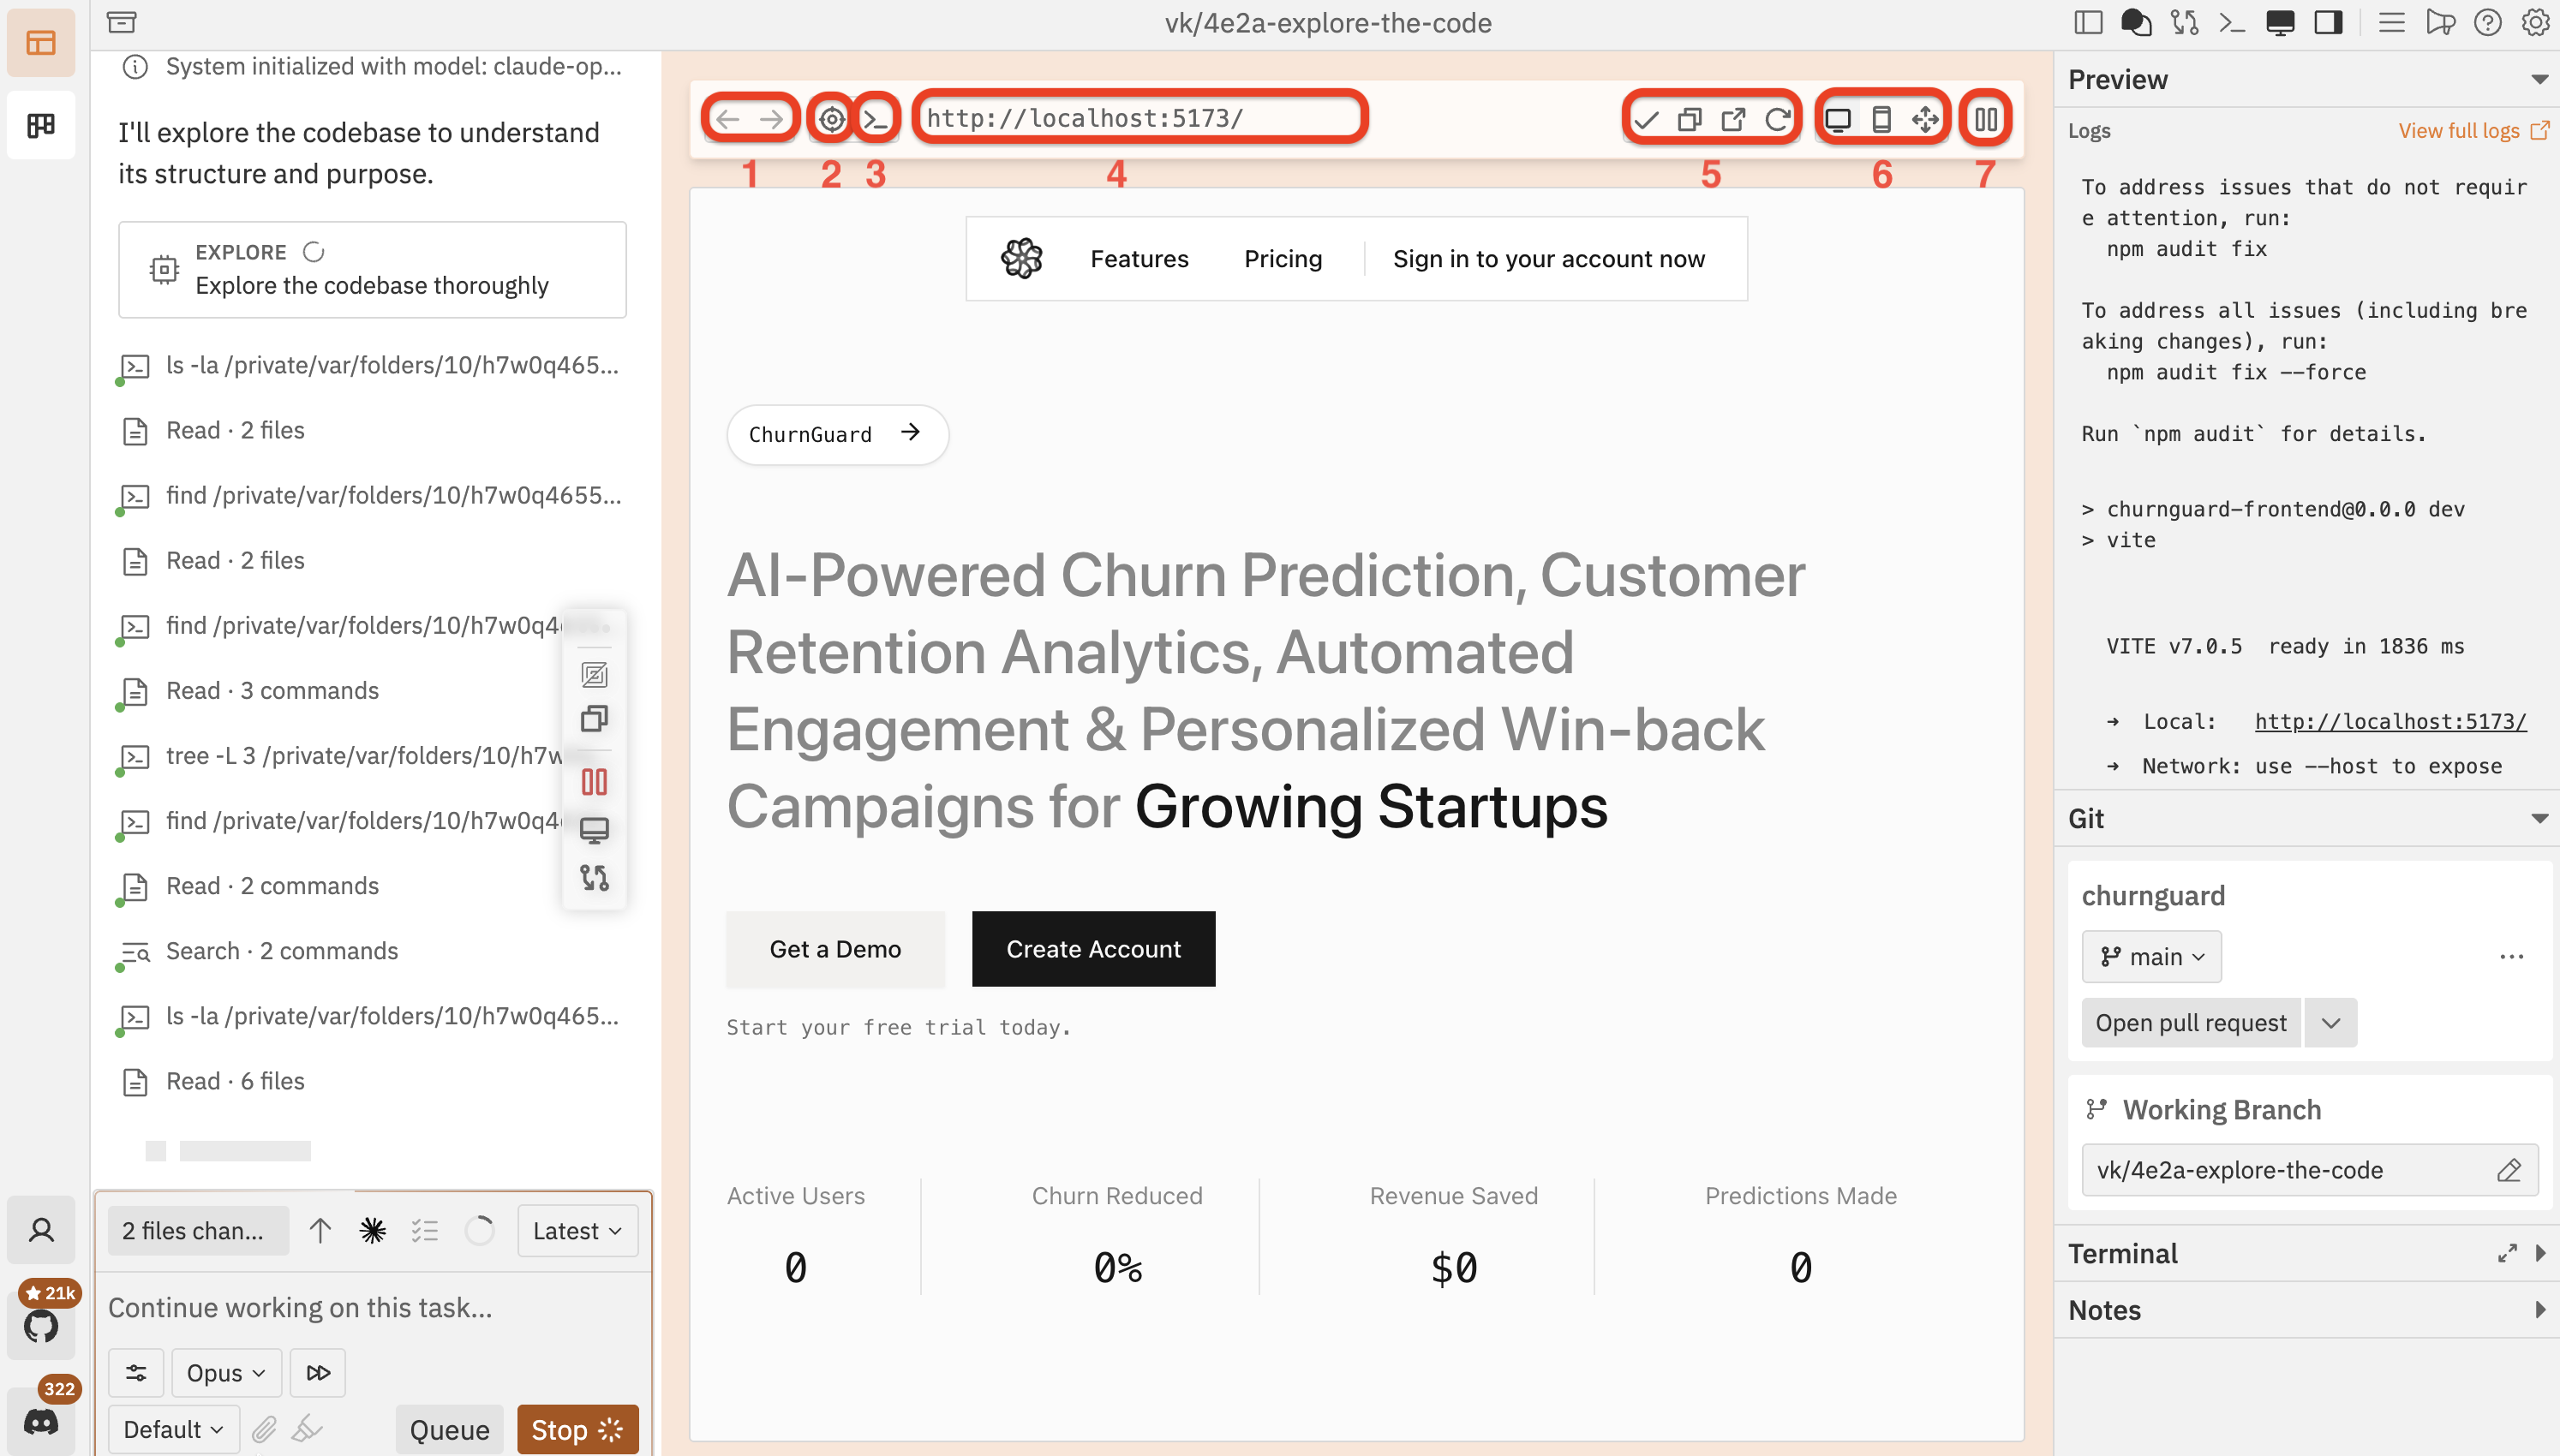
- Back / Forward — navigate between pages
- Inspect (crosshair icon) — enter click-to-component mode
- DevTools (terminal icon) — toggle the built-in devtools panel
- URL bar — shows the current page address; type a URL to navigate manually
- Page actions — submit, copy the URL, open in a new tab, and refresh
- Device modes — switch between Desktop, Mobile, and Responsive views
- Pause — pause or resume the dev server
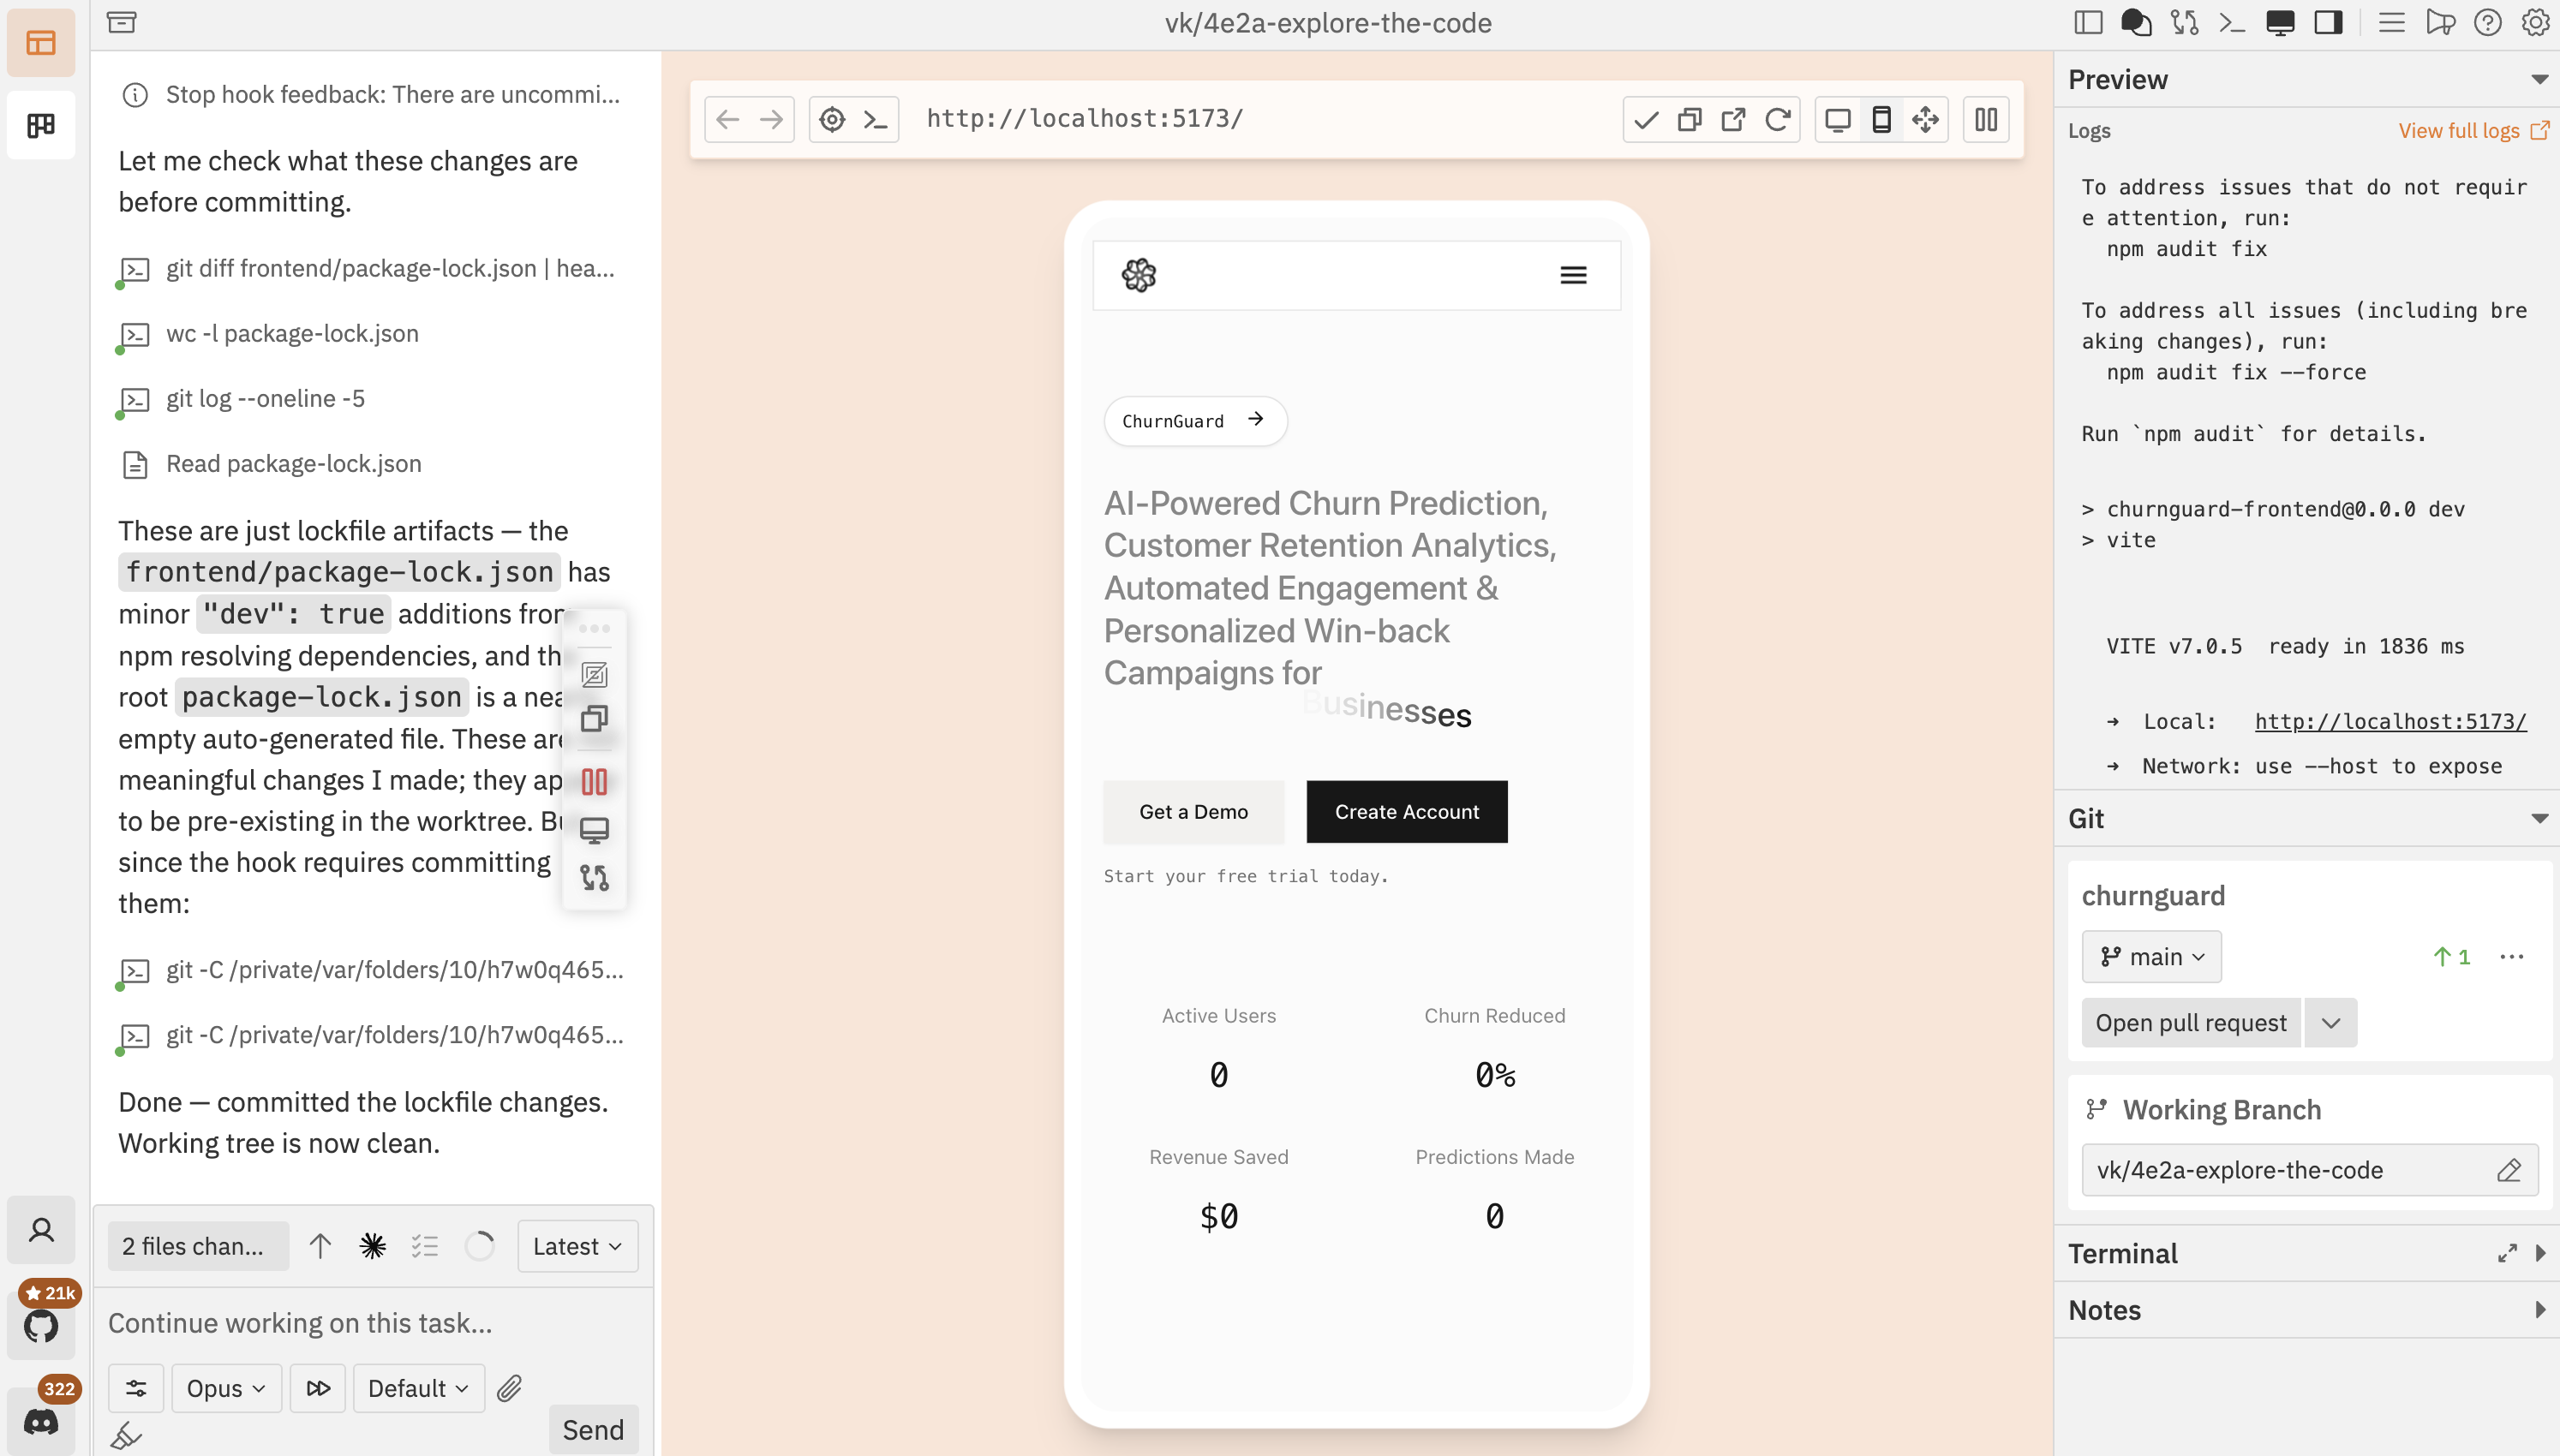
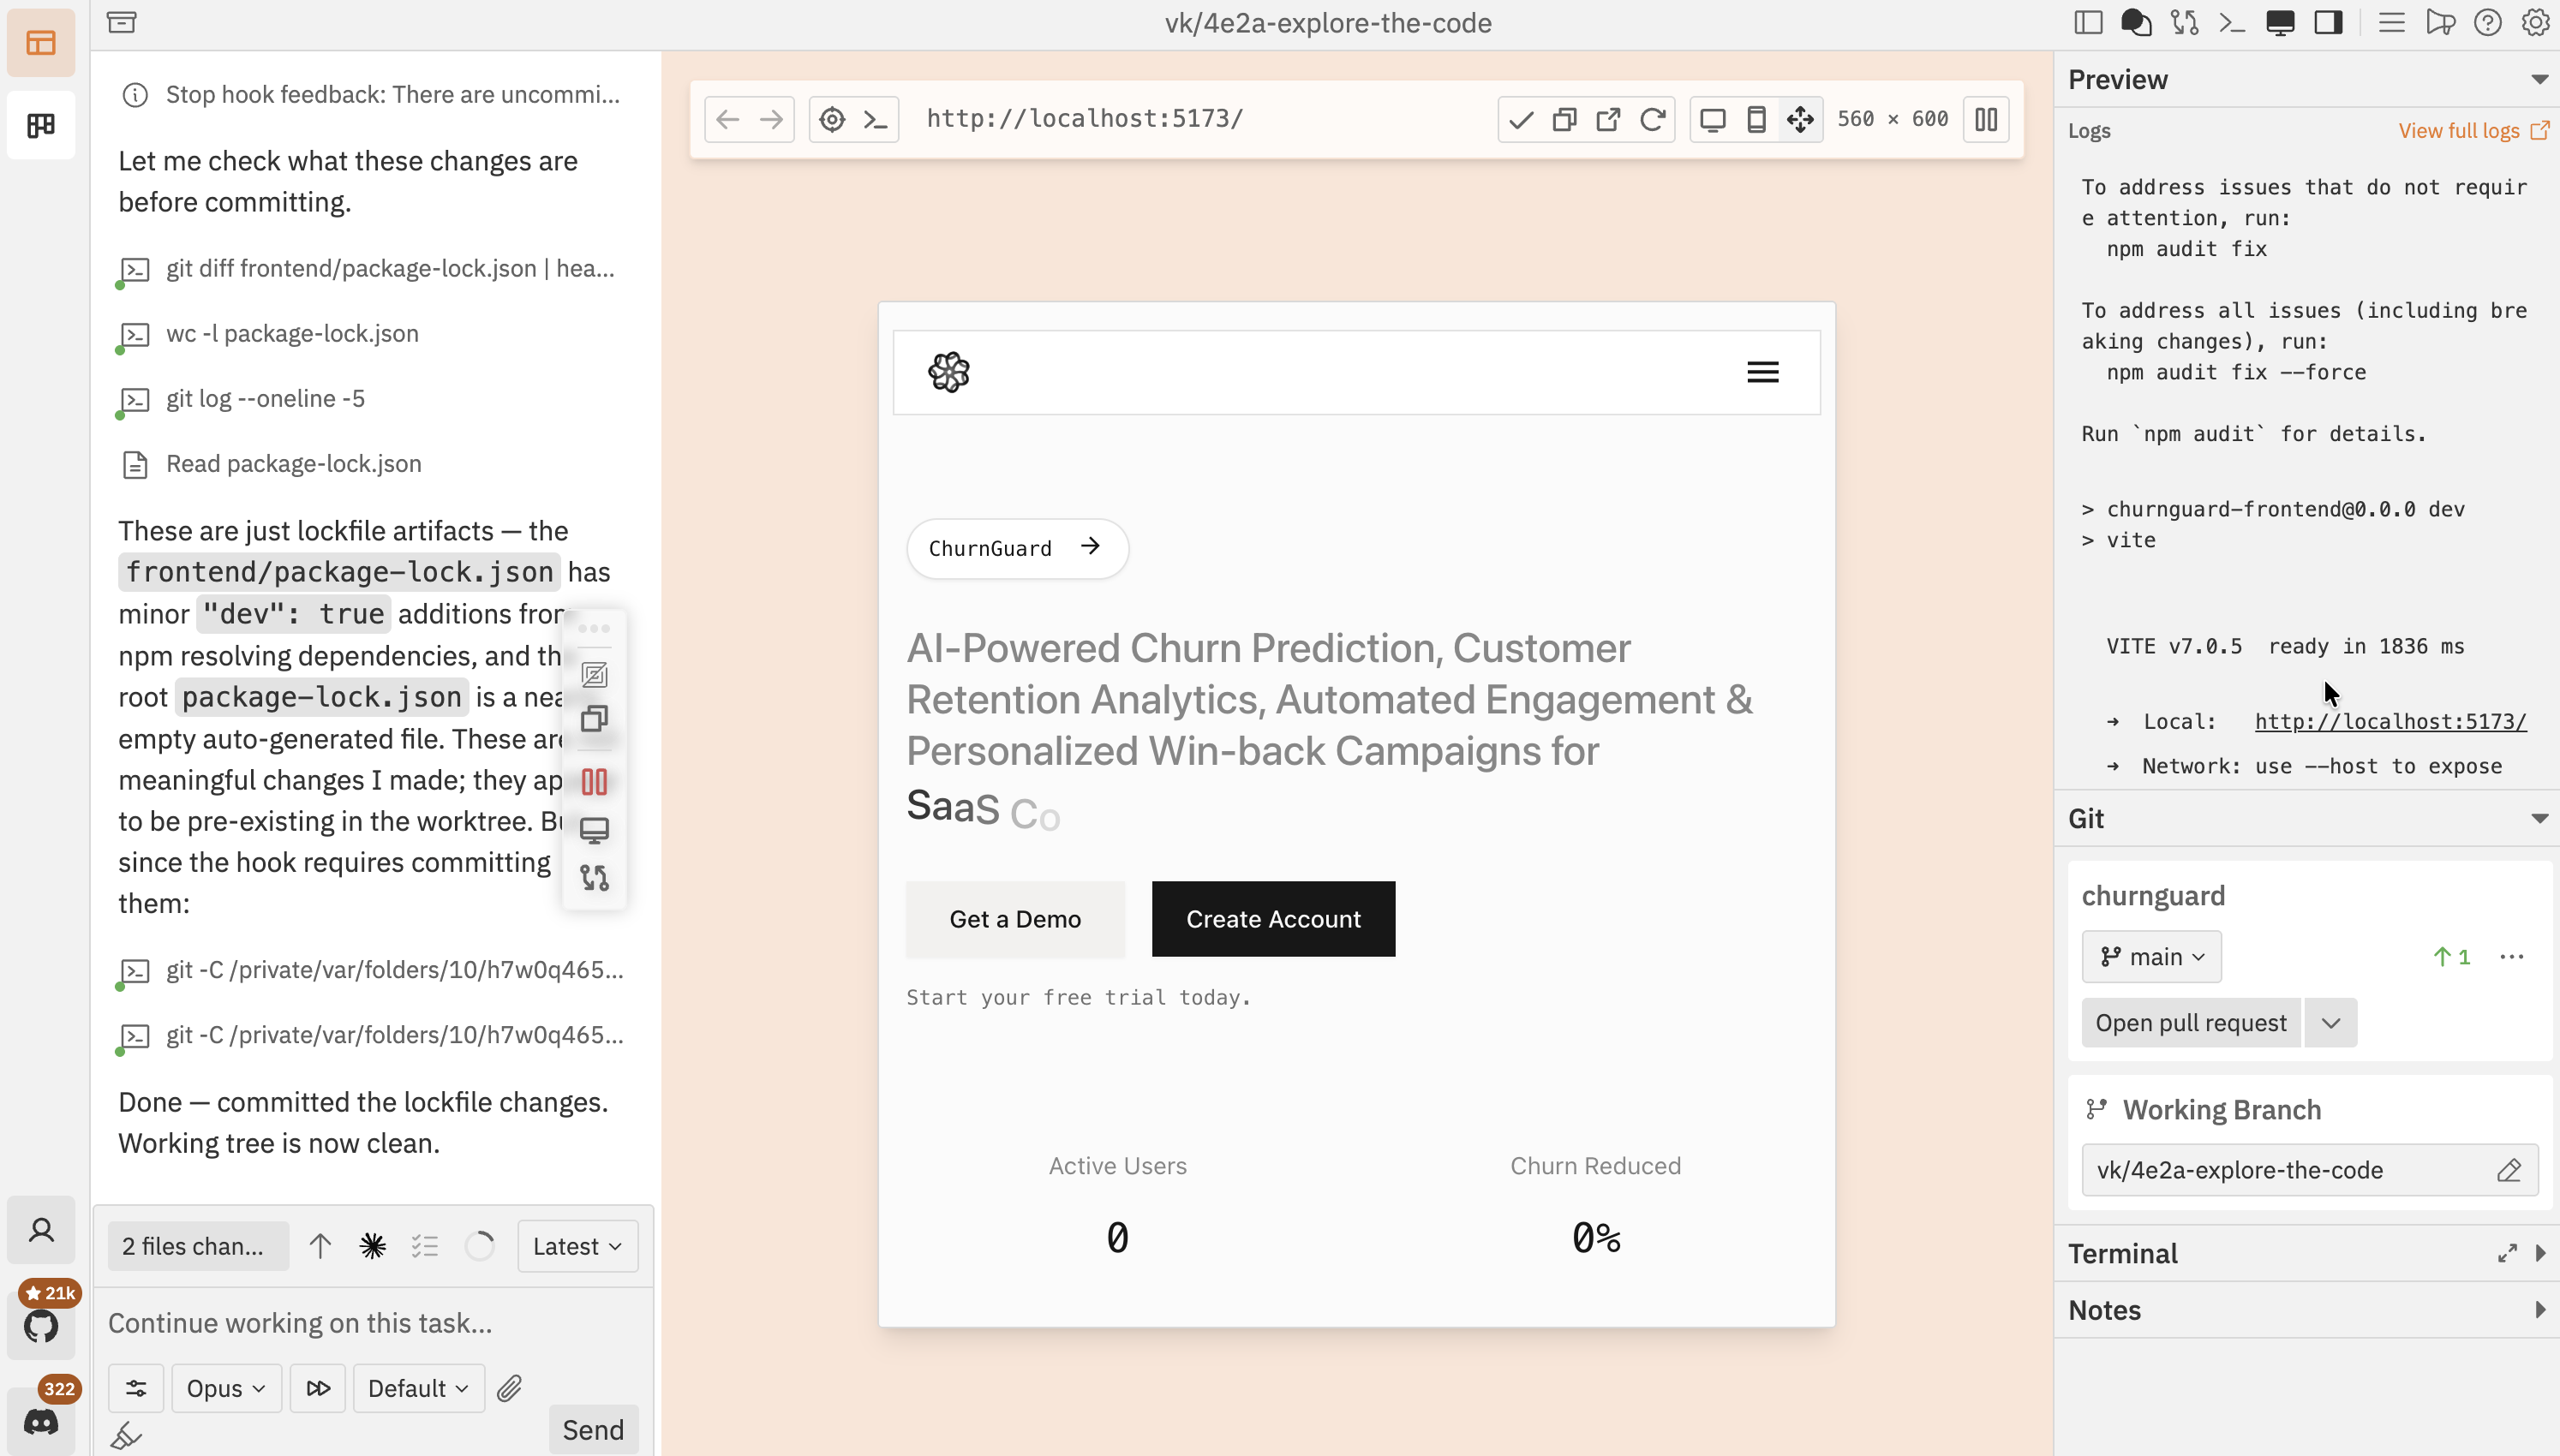
4. Switch device modes
You can test your application across different viewport sizes without resizing your browser window. The device mode buttons in the toolbar let you switch instantly.| Mode | What it does |
|---|---|
| Desktop | Full-width browser view |
| Mobile | Phone frame at 390×844, with device chrome |
| Responsive | Drag the edges to set a custom width and height |
5. Inspect components
The preview browser includes a built-in click-to-component feature. Click Select element as context in the toolbar to enter inspect mode, hover over any element to highlight it, then click to select.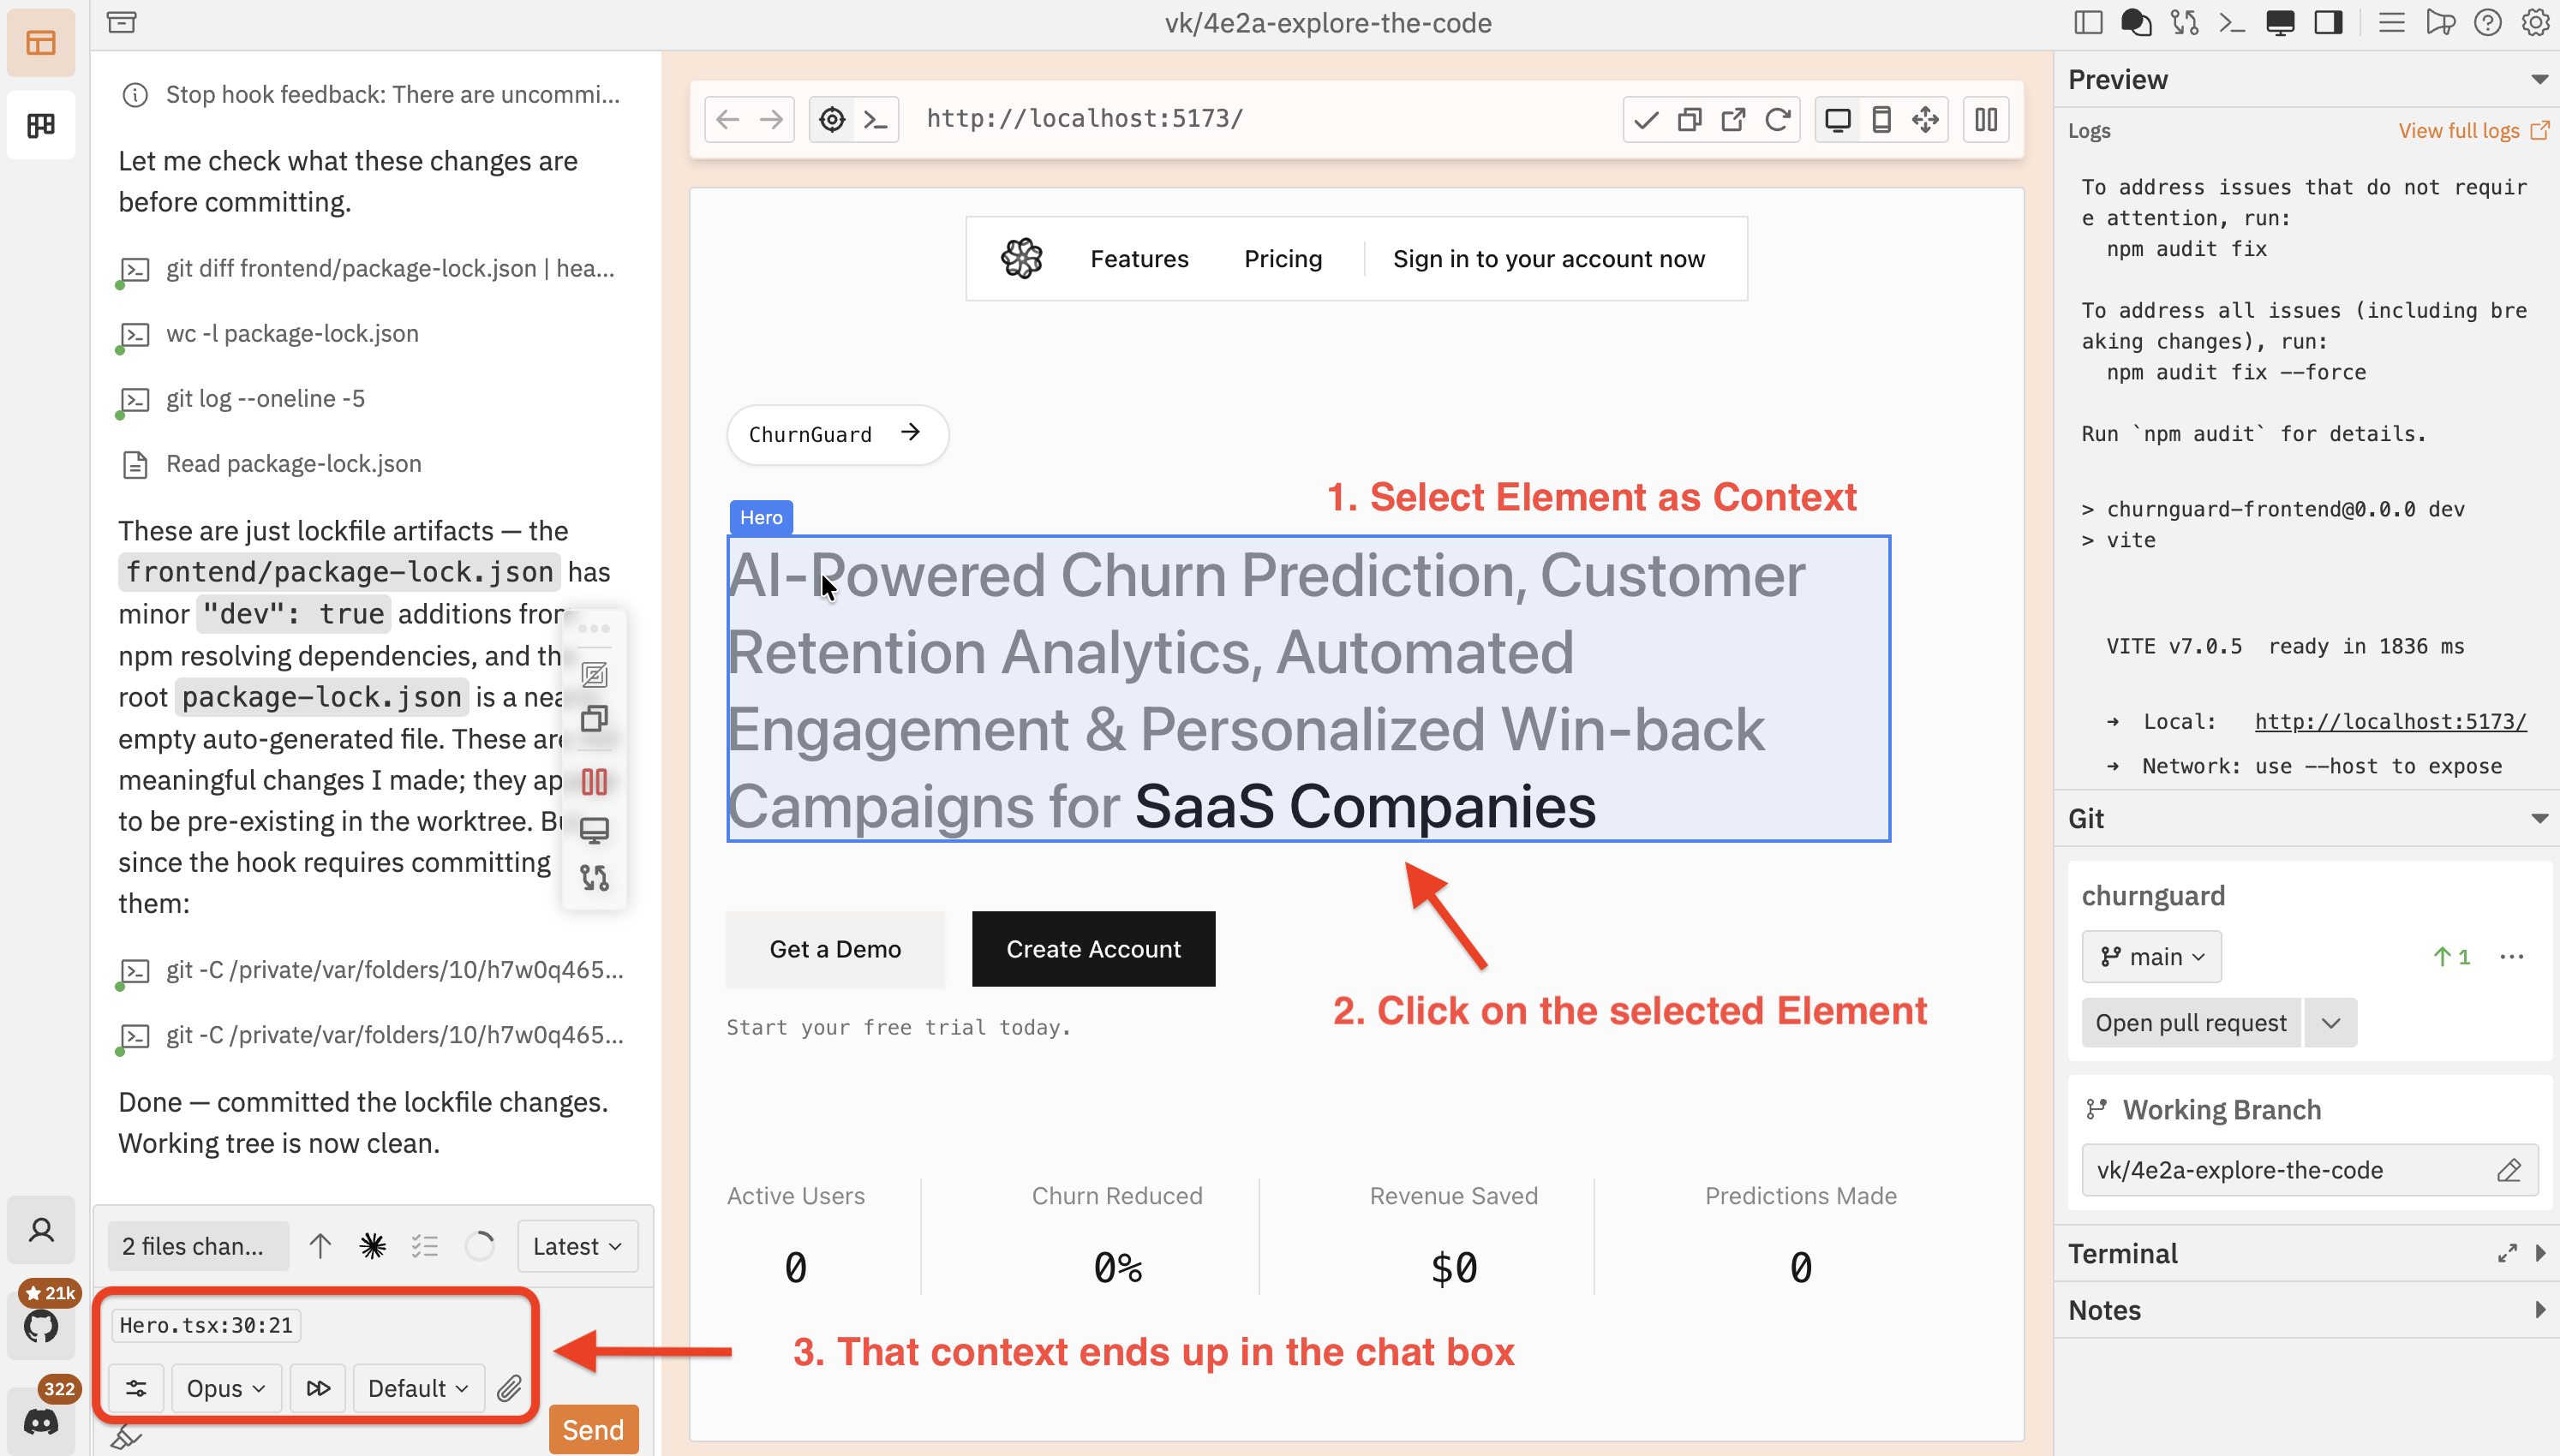
6. Open DevTools
Click the terminal icon in the toolbar to toggle the built-in devtools panel. The devtools open at the bottom of the preview and give you a full debugging console without leaving the workspace.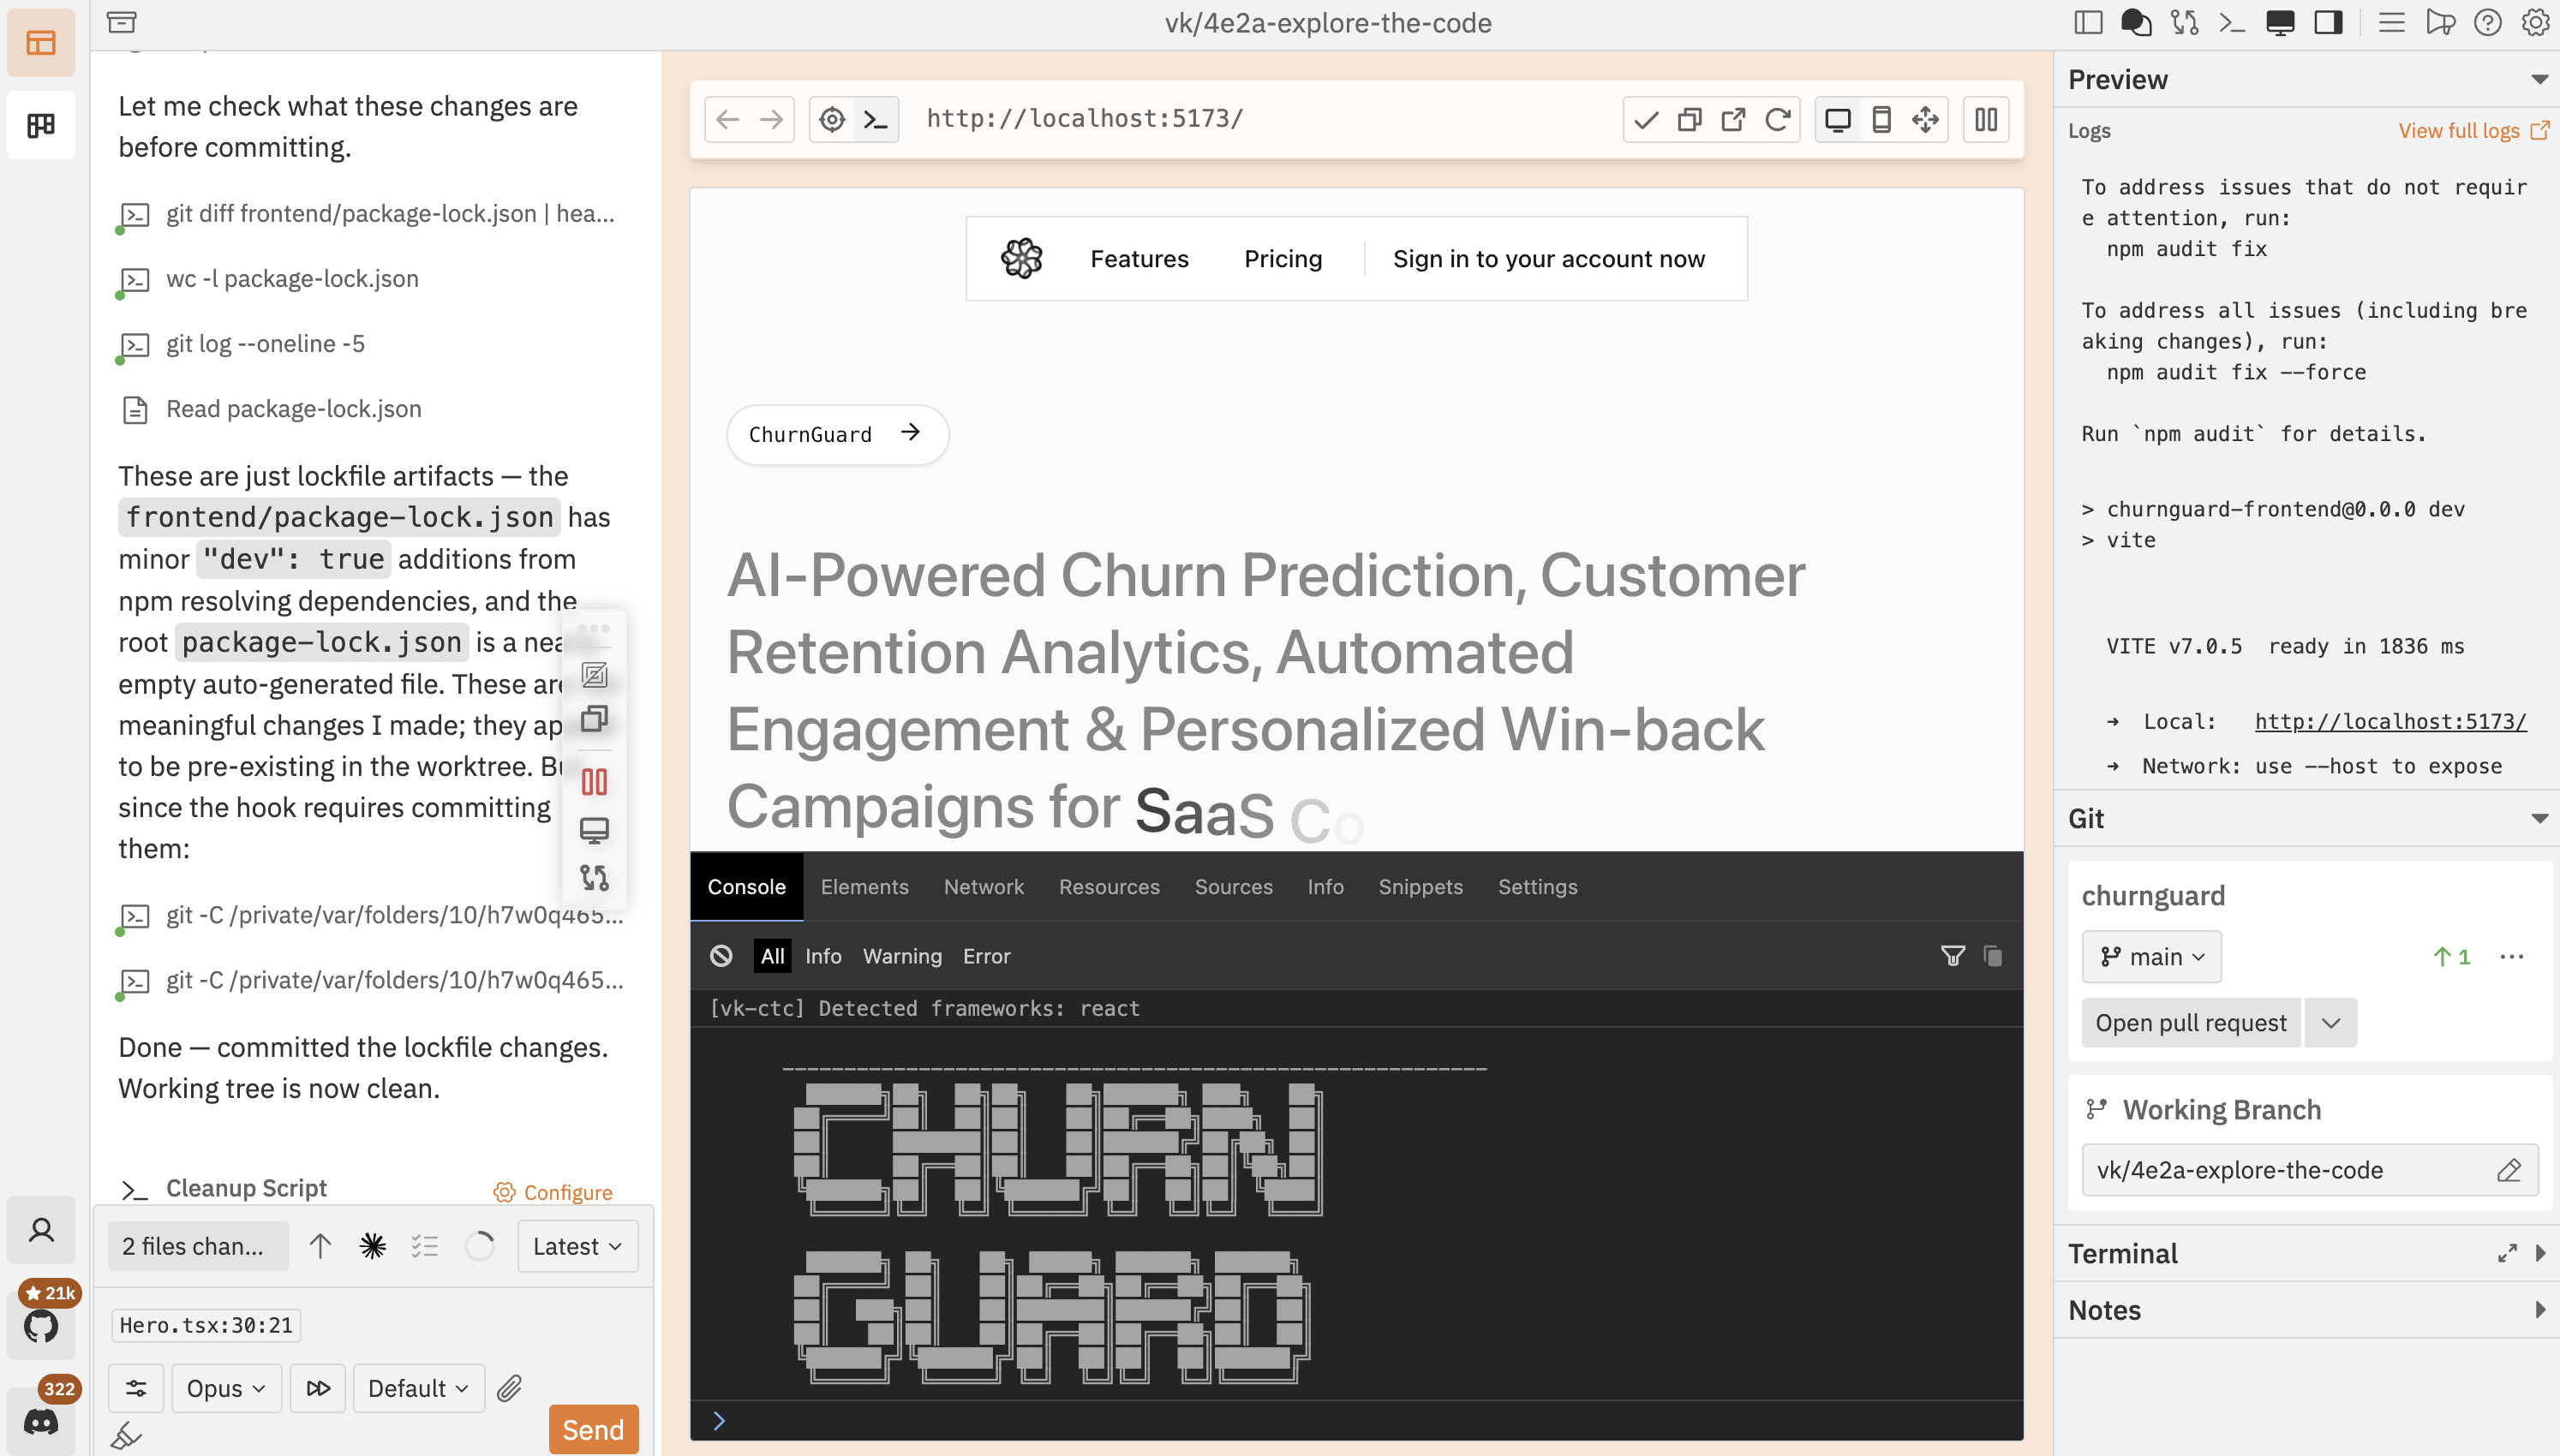
- Console — view logs, warnings, errors, and run JavaScript
- Elements — inspect and modify the DOM tree
- Network — monitor requests and responses
- Resources — view cookies, localStorage, and sessionStorage
- Sources — view the page source code
- Info — check the page URL, user agent, viewport size, and device details
DevTools are powered by Eruda, a mobile-friendly debugging console. They run inside the preview iframe, so they reflect exactly what your application sees.
Troubleshooting
Preview shows a blank page
Preview shows a blank page
- Check the log output for errors — the dev server may still be starting
- Verify the correct URL is detected in the preview address bar
- Try refreshing the preview with the refresh button
Preview doesn't update after changes
Preview doesn't update after changes
- Check the logs for build errors
- Try a hard refresh (
Cmd/Ctrl + Shift + R) - Restart the dev server with the play/pause button
- Verify your framework supports hot module replacement (HMR)
Port conflict error
Port conflict error
Another process is using the same port. Find and stop it, or change the port in your project config. Run
lsof -i :3000 (replace 3000 with your port) to see what’s using it.Inspect mode doesn't detect components
Inspect mode doesn't detect components
- Make sure the dev server is running a development build (production builds strip component metadata)
- For React, ensure the app has loaded before entering inspect mode
- The HTML fallback always works — if you see tag names instead of component names, the framework adapter couldn’t detect the framework
Next steps
Changes panel
Review diffs and provide feedback to your coding agent
Projects & Repositories
Configure setup, cleanup, and dev server scripts per repository